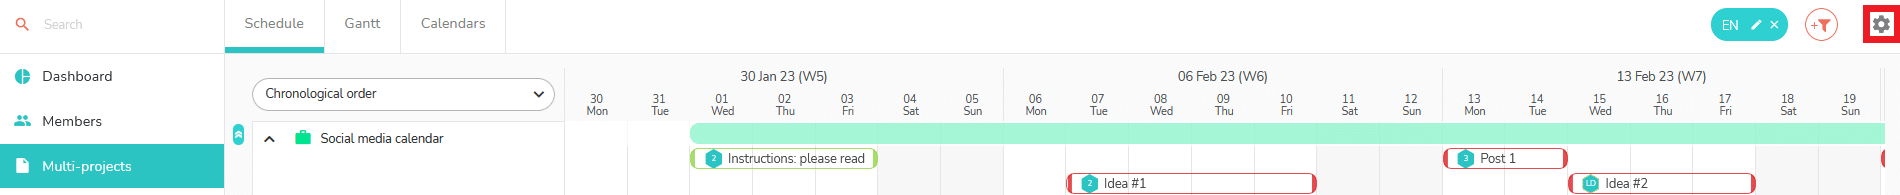
Multi-project view display options
To access the display options, simply go to your Multi-projects view and click on the red-framed “Projects settings” icon:
Project Order (Planning and Gantt Views)
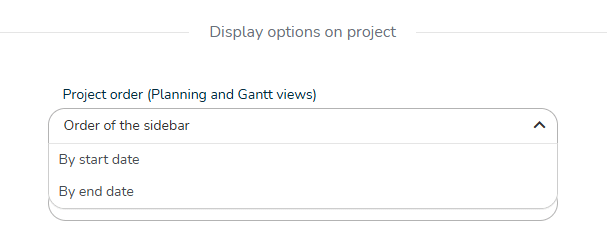
You can choose to present projects in the Planning and Gantt views:
- In the order listed in the projects sidebar.
- By project planning start date.
- By project planning end date.
Information displayed on the task (Gantt view)
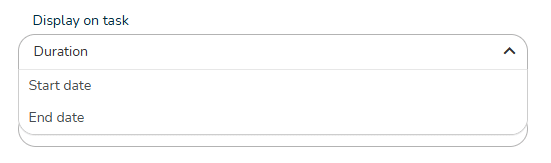
You can display one of three values on the task, to the right of the task name in the Gantt view:
- The task’s duration.
- The start date.
- The end date.
Tab displayed when opening a task
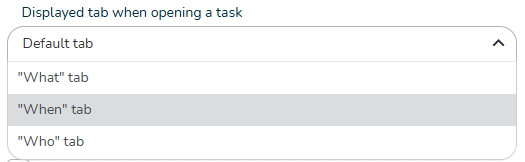
When you open a task in one of the multi-project views, you can define which of its tabs the task will open in by default:
- The What tab.
- The When tab.
- The Who tab.
If you stick with the default opening, here’s the mechanism that applies:
- From the Schedule view, the task opens in the What tab.
- From the Gantt view, the task opens in the When tab.
- From the Calendars view, “Tasks” view, the task opens in the When tab.
- From the Calendars view, “Times” view, the task opens in the Who tab.
- From the Calendars view, “Simulate with initial times” view, the task opens in the Who tab.
Side panel displayed when opening a task
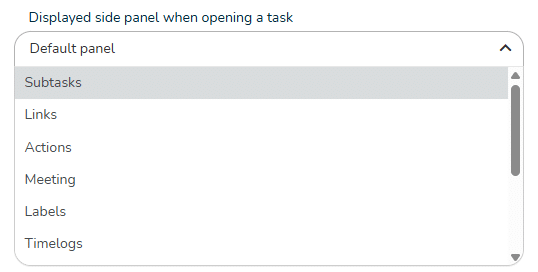
With this option, you can choose which task sidebar will automatically open when you open a task in one of the multi-project views:
- Subtasks.
- Links.
- Actions.
- Meetings.
- Time.
- Etc.
By default, no sidebar opens, except for the action panel, if some of them are not completed.
Thicken task borders

This option is used to thicken the borders of tasks so that they are more visible in the various Multi-projects views.
If the box is not checked, the borders of the tasks only thicken when you hover the mouse cursor over them.
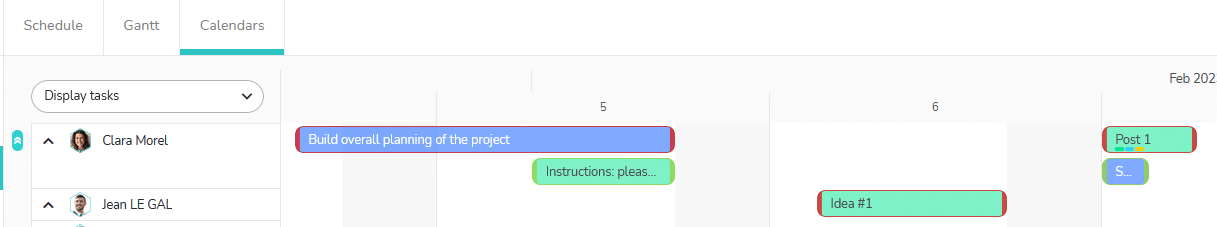
Choose what should be displayed in the task, on the schedule (Gantt view)
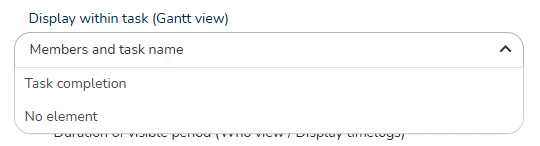
In the Gantt view, you can choose to display one of the following options on scheduled tasks:
- The names of the members assigned to the task, and the task name.
- The task’s percentage of completion.
- No items.
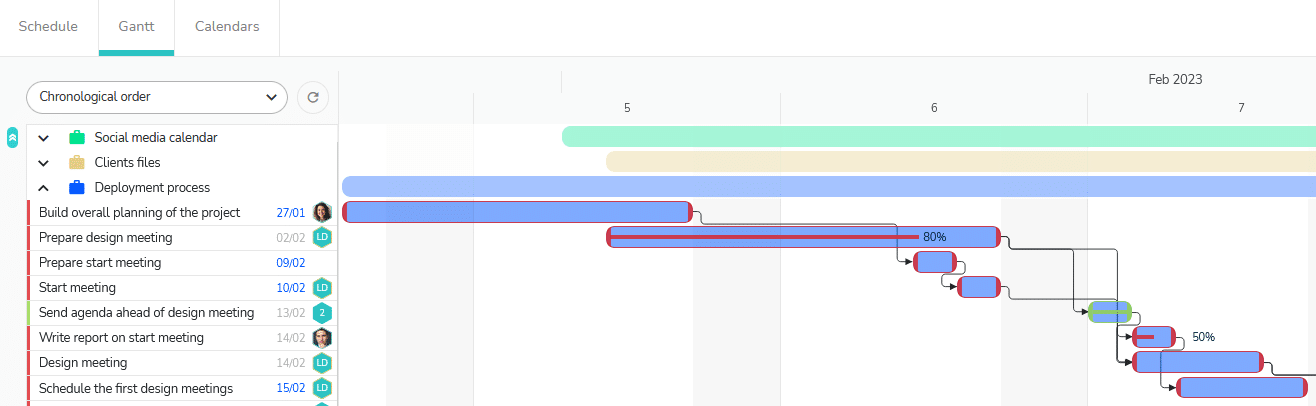
The percentage of completion is indicated in the “What” tab of the tasks, and here’s how this percentage appears on the Gantt view if you choose to display it:
Show only tasks from the visible period (Calendars view, time display)
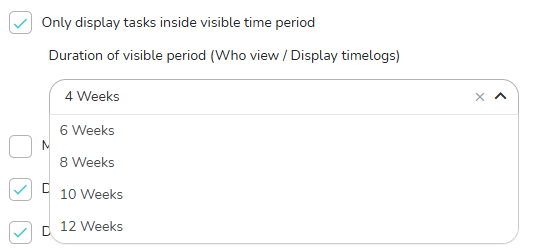
This option is always checked to optimize loading times. It loads only tasks from the current period, whose start and end dates can be seen in the bottom right and bottom left corners of your schedule.
This period can be reduced by choosing a smaller value from the drop-down menu. This allows for less data to be loaded, but also prevents tasks from being displayed that might fall outside your planning period, which would unnecessarily burden your schedule.
Highlight planned times (Calendars view, tasks display)

By ticking this option, which concerns the Calendars view with task display, you make the days on which times have been entered visible on the tasks.
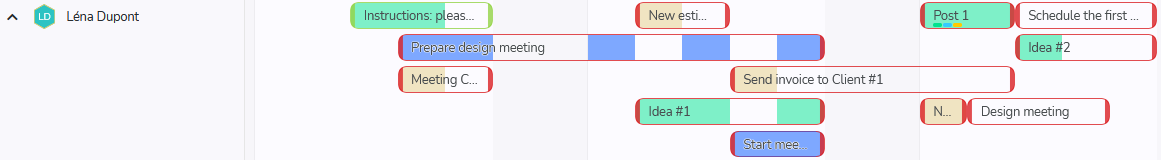
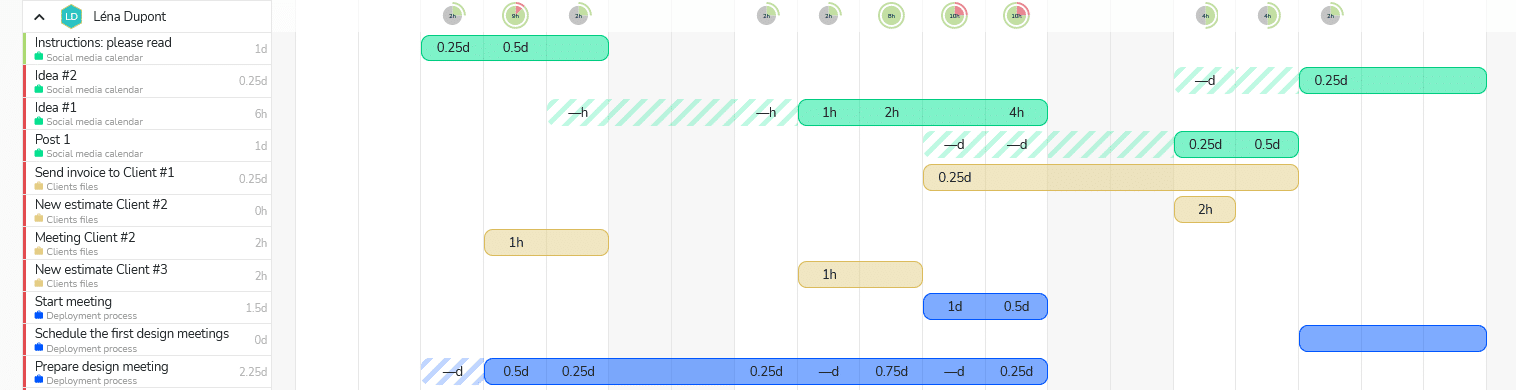
Display the project name on the task (Calendars view: “Display times” and “Simulate with initial times”)

By checking this option, you display the project name under the task name located on the left in the views with the occupancy rates:
Show only members affected by the filter (Calendars view)

This option allows you to narrow down the items displayed on the screen in the Calendars with times display by focusing on a value selected in the filter.
For example, in the advanced filters, you can choose to filter on scheduled times for tasks by selecting the “Included” option.
In this case, if you have checked the “Show only members affected by the filter” option, this will display only members assigned to tasks for which scheduled times have been entered.